3 charts illustrating the strong growth of US online retailing
Recently there has been discussion around slowing of the online retail growth. Despite this discussion, the absolute dollars for the online channel have kept on growing even on top of the strong growth from the pandemic.
On the left hand chart one can see that the share of all retailing sold online has plateaued during the 2021 and early 2022. The right hand chart illustrates how online channel has grown in absolute dollars.
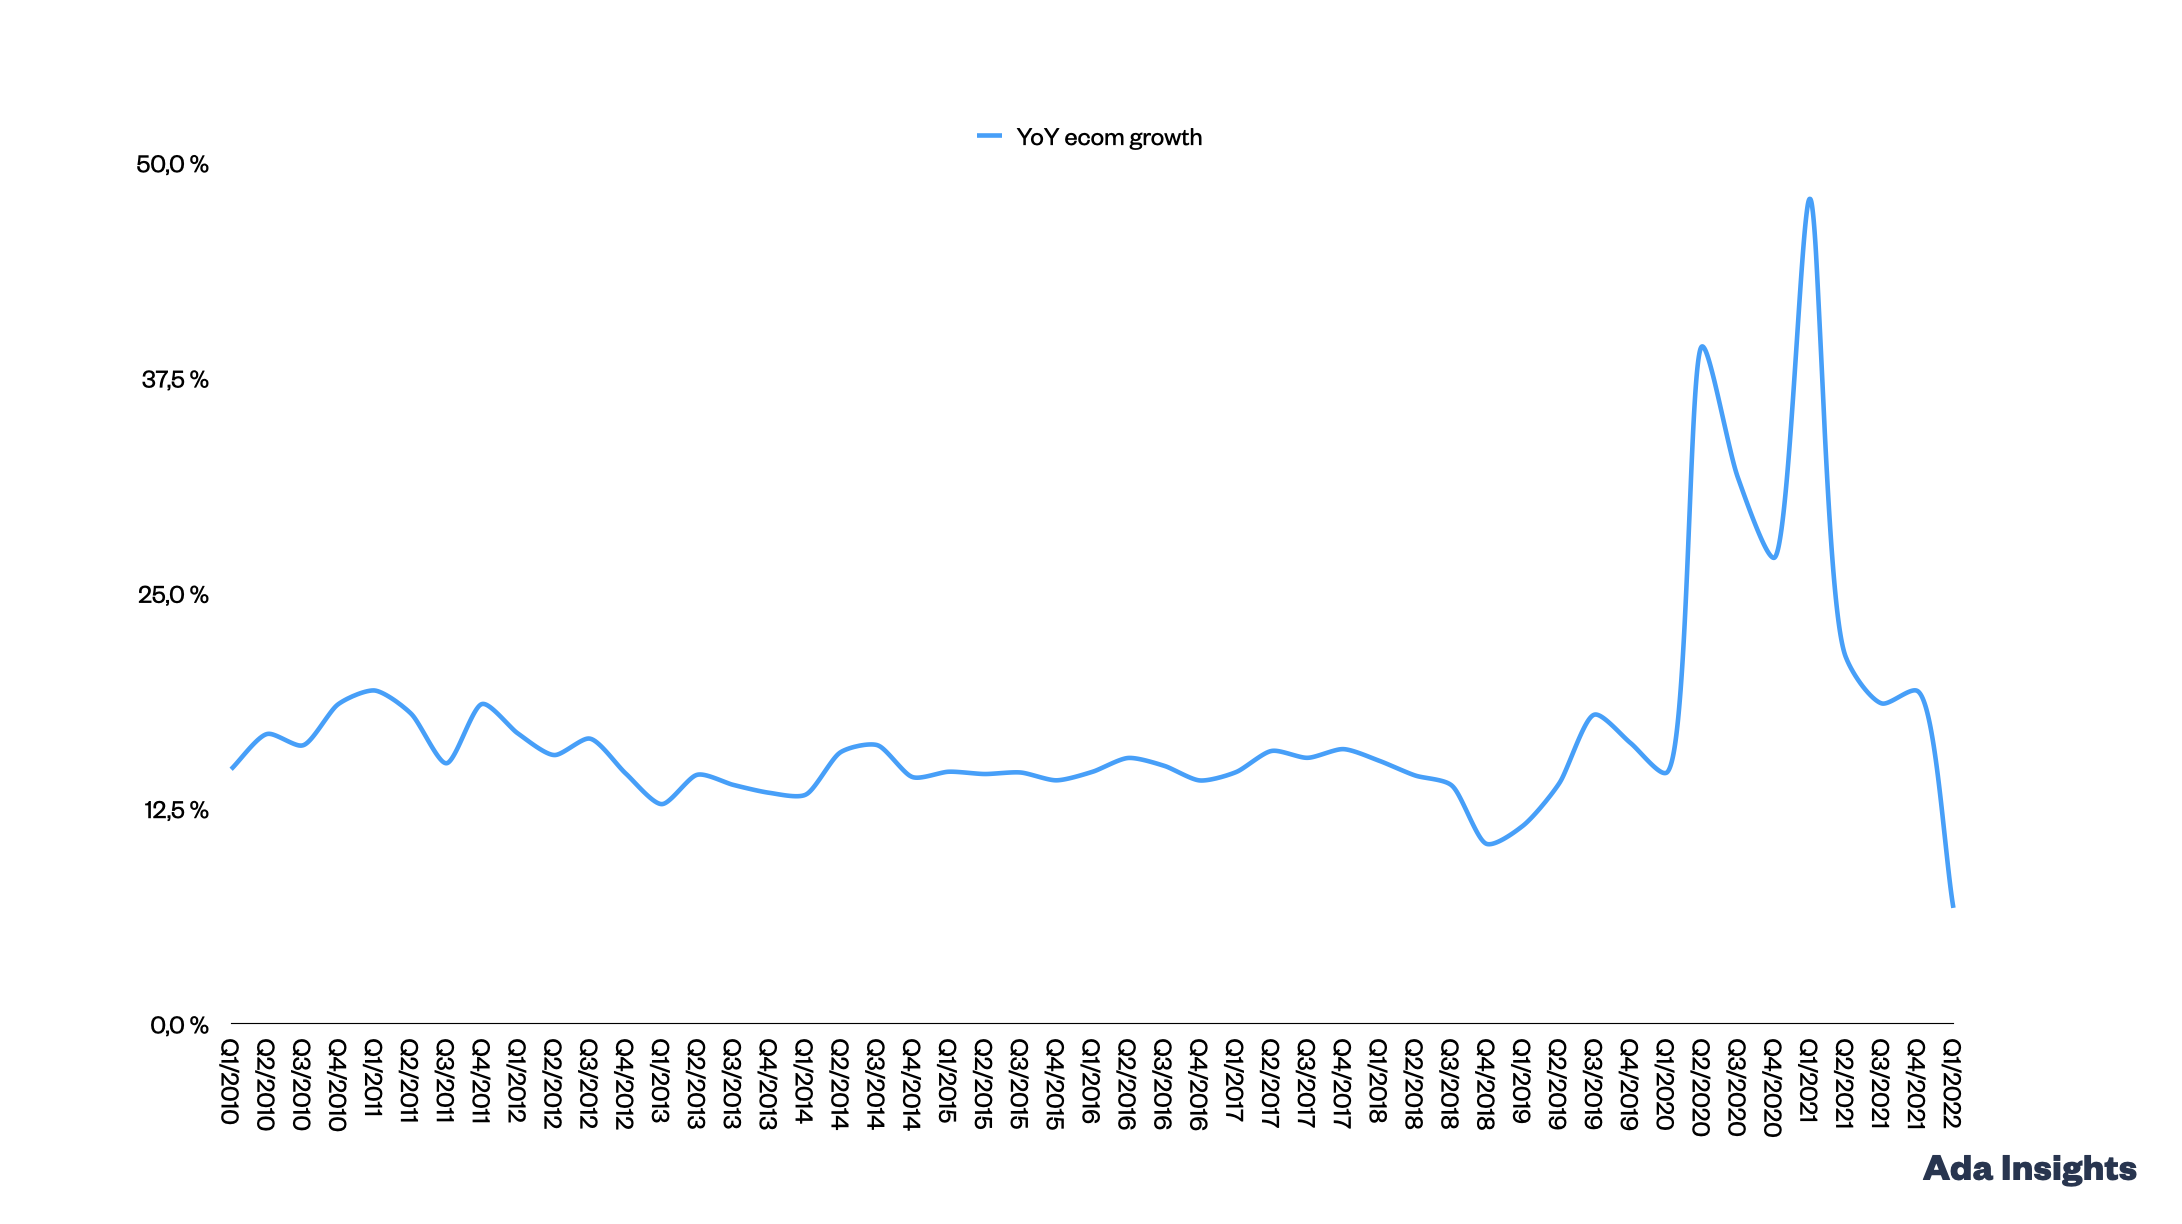
Online channel growth jumped as the pandemic started, but the channel has remained on a growth path throughout the post pandemic retail environment. In Q1/2022 the online channel grew by 6,7%, which is slowest growth since the financial crisis on 2008/2009. However, that 6,7% growth came on top of 47,9% growth in Q1/2021.
For the last 12 months, ecommerce channel has had almost $1 000 billion in revenue. That is 58% more than the 12 months before the pandemic.
Online growth is illustrated as it is compared month by month between different year. In pandemic times online took a step change in the sales level. From that level online has kept on growing at a robust rate.
Stores on the other hand struggled in 2020, but flourished in 2021. That is why the share of online out of all retailing did not grow in 2021 despite online as a channel growing. The growth for stores in 2022 has been on a more normal level.
With this kind of growth dynamics it is only realistic that the online share will eventually also pick up pace.


